1990
add kanpur_1990.jpg to /images
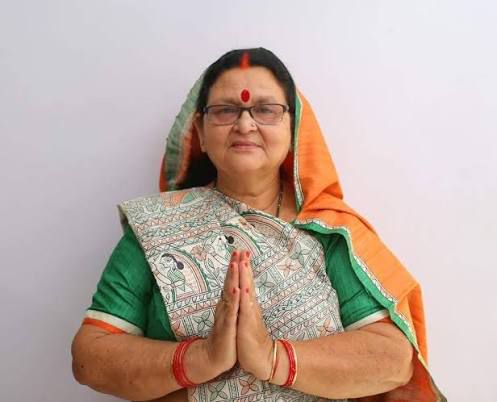
Our deepest thanks to Honourable Mayor Pramila Pandey for her steadfast support in making this study possible, and for her tireless dedication to Kanpur — working to make the city better, cooler, and more liveable, day by day.
इस अध्ययन को संभव बनाने में उनके सहयोग तथा कानपुर को प्रतिदिन बेहतर बनाने के प्रति उनके समर्पण के लिए माननीय महापौर श्रीमती प्रमिला पांडेय जी का हार्दिक आभार।
Kanpur · Urban Climate Resilience
A citizen-led research initiative reading Kanpur through three and a half decades of satellite imagery, open climate data, and ground truth — turned into plain-language tools for residents and the Nagar Nigam. Watch the city change below, or switch on the heat layer.
We are a neighbourhood-rooted civic group studying how heat, air, and water are changing across Kanpur — and making that knowledge usable by the people who live with it.
Mera Apna Shahar grew out of a simple idea: the people of a ward understand its problems first-hand, and they deserve the same satellite and climate evidence that planners use. We combine remote sensing, open municipal data, and street-level observation to map how Kanpur is heating and how its air and rainfall are shifting.
Every study is published as a bilingual Hindi–English report in plain language, attributed to our community, and shared with residents, ward councillors, and the municipal corporation. Our work is framed around the 74th Constitutional Amendment — strengthening the role of urban local bodies in protecting their own people.
We don't just describe the problem. We hand over the maps, the numbers, and a roadmap that a ward can actually act on.
The community banner under which ward-level climate studies are researched, written, and released to the public.
Our partner in civic engagement — connecting findings to ward councillors and municipal decision-making.
Reports and roadmaps are shared with the city administration to support local climate action.
Founders, advisors, and researchers who bring together civic organising, urban governance, and Earth-observation science.
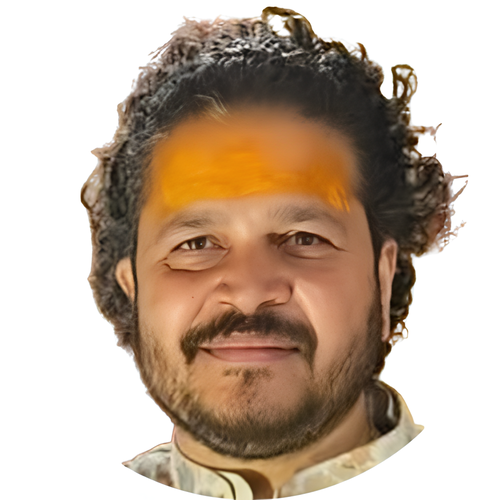
Urban governance & Satellite analysis, GIS, and data pipelines.
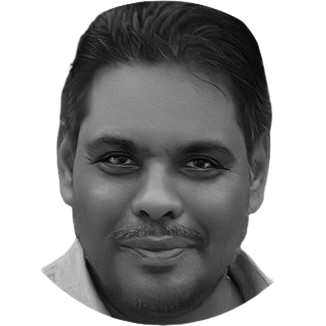
Community organising in Kanpur
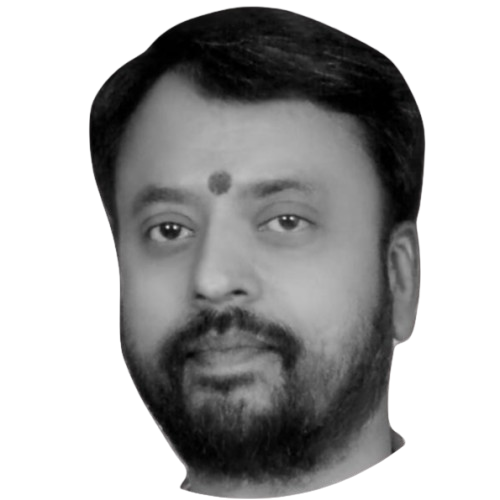
Manage Project witin Kanpur

Manage Scientific Data for Kanpur
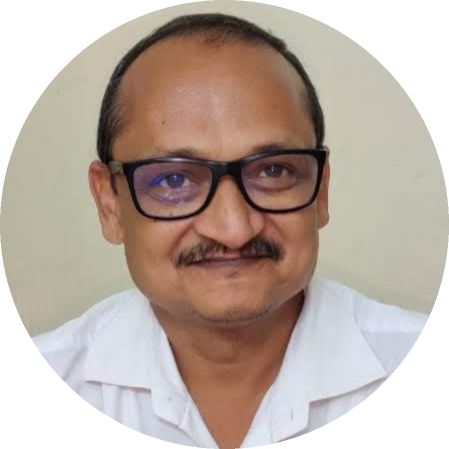
Municipal policy, Heat, air quality & community health.
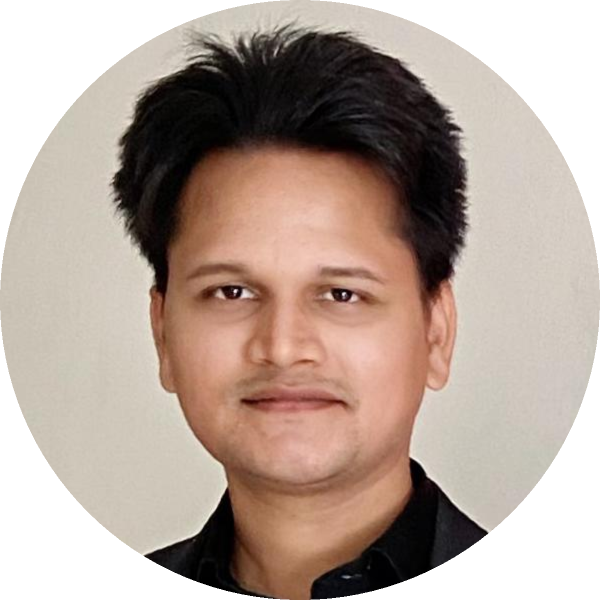
Municipal policy, Heat, air quality & community health.
//Super team working with 100+ Kanpur Municipal Corporators
Live research streams across heat, air, water, and policy — each grounded in real ward boundaries and open Earth-observation data.
Live ERA5 reanalysis temperatures fused with WorldPop population density across Kanpur — one map that shows where the thermal burden falls heaviest on the most people. Switch layers to explore each dimension separately.
Open satellite and climate data, processed transparently, aggregated to Kanpur's 110 wards, and published so anyone can check our work.
Pull open imagery and climate layers from public archives through Google Earth Engine — no proprietary data.
Mask clouds and shadows using quality bands, then scale to surface reflectance for consistent comparison across years.
Combine many scenes into a per-year median image, removing haze and gaps to get one clear view of each year.
Derive indicators — vegetation (NDVI), land-surface temperature, NO₂ & aerosols, rainfall, and heat indices.
Clip and summarise every indicator to all 110 municipal ward boundaries, so findings map to real governance units.
Validate, translate, and release bilingual Hindi–English reports with the maps and data behind every claim.
We are committed to open, reproducible evidence. Anyone should be able to see where a number came from and rebuild it.
Half a century of imagery and thermal bands — the backbone of our land-cover, urban-growth, and land-surface-temperature work.
Sentinel-2 for fine vegetation & built-up mapping; Sentinel-5P/TROPOMI for NO₂ and air-quality monitoring.
Daily rainfall since 1981, used to detect Kanpur's shifting monsoon and dry-spell trends.
Hourly temperature, humidity, and wind — the basis for heat-index and exposure analysis across the city.
The data is about real streets, the river, and the people who live here. These cinematic frames of Kanpur — the Ganga, the barrage, JK Temple, Kanpur Central, the Memorial Church, and the city zoo — ground the work in the place it serves.
// Glimpses of Kanpur.
This is a civic project — it works when residents take part. Request the evidence for your ward, use our open data, report what you're seeing on the ground, or join the team.
Residents, councillors, journalists, and researchers — reach out for reports, maps, or collaboration. The evidence belongs to the city.